Skip to content

UK finance teams

+44 7457 162137
Acinarypath

Finance analytics

Models a controller can explain without opening the file.

Analytics for a finance team is not a gallery of charts. It is a chain: driver, amount, owner, and the sentence that says what moved. Acinarypath builds that chain for FP&A, margin, cash, and the forecast.

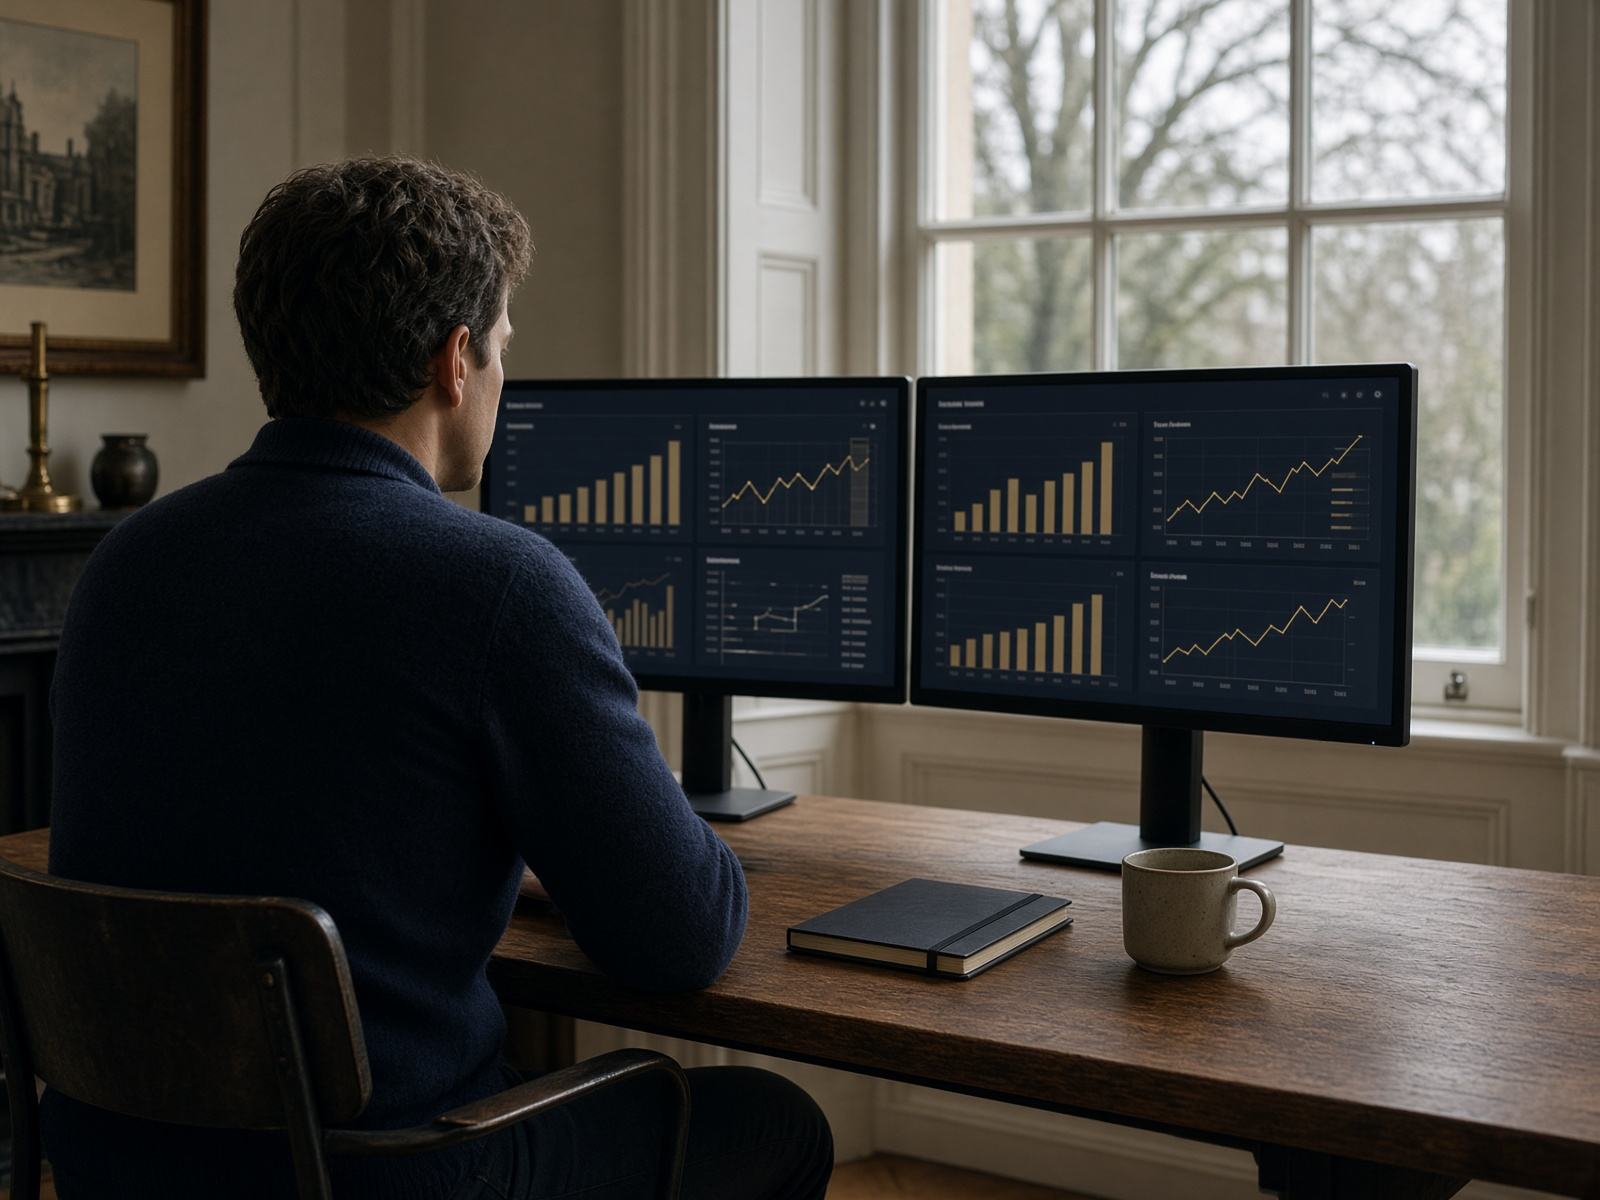
An analyst at a walnut desk with two monitors showing blurred charts and a sash window beyond

Driver trees before dashboards.

We sit with the people who already explain the month and write the tree they are using in their heads. Revenue might split by price, volume, and mix. Contribution might then take direct labour, materials, and carriage. Operating profit takes the costs that do not flex. The tree is agreed in words before it is agreed in a tool.

Where a business has several sites or service lines, the tree repeats with the same names. Local colour is allowed in commentary. It is not allowed in the meaning of gross margin.

A bridge, fully named

Illustrative structure. Not a client outcome and not a target.

  1. Opening forecast or budgetbase
  2. Pricedriver
  3. Volumedriver
  4. Mixdriver
  5. Cost rates and usagedriver
  6. Items that will not repeatflagged
  7. Actual or latest forecastclose

What we model, and what we leave as judgement.

Rolling forecast

A forecast with a horizon the business can actually see, usually twelve or eighteen months for a private UK company, refreshed on a calendar rather than whenever someone has a strong feeling. Actuals replace forecast months. They do not sit beside them forever.

Margin and mix

Customer, site, product, or matter. We pick the cuts finance will defend. A hundred slices that nobody reviews are not analysis. They are a filing system.

People cost

Headcount, full-time equivalent, starters, leavers, and the cost that payroll recognises. Agency and overtime are visible, because that is where many “vacancy savings” go to hide.

Cash and working capital

Debtors, creditors, stock, and the cash conversion pattern of this business, not a textbook ratio dropped on a slide. A thirteen-week view where the treasurer or the FD already thinks that way.

Scenarios with names

Each scenario lists the assumptions that moved: a price, a volume, a hiring date, a receipt profile. If an assumption cannot be written in a sentence, it does not go in the model.

What we will not pretend

We do not sell an automatic forecast that replaces a finance team. Statistical fits can be a cross-check. They are not the commentary, and they are not a promise about next year.

Three colleagues standing at a glass wall of blank cards during a definitions workshop

Independent of the logo on the software.

Some teams already have a sound extract from the ERP and a reporting tool their analysts can support. Some are still in a controlled workbook and should stay there for another year. We are not a reseller, and we do not require you to change platform so that we can build. If a tool cannot hold the control we need, we say so and we show the gap.

Finance business partners get slices they can filter, inside guardrails: they cannot rewrite revenue, and they can see when the source last refreshed. Self-serve without a definition is how the argument starts again.